Sign in for exclusive products and special discounts.
16 September 2013
The Venn Diagram: Is It Analysis?
by Shelagh A. Gallagher
Bloom’s taxonomy (and its re-articulation by Anderson, et al.) contains a wealth of detailed information about different levels of thinking. Unfortunately, the taxonomy is rarely presented in enough depth to appreciate its nuances. The purpose of this post is to take a closer look at the category of analysis.
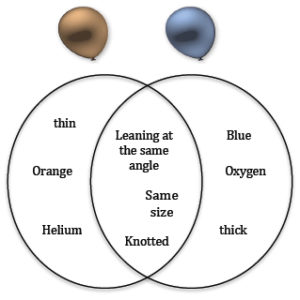 A picture of two balloons, one blue and one orange, hangs on the bulletin board. Children have empty Venn diagrams on their desks. Their job: compare and contrast. They get to work. The first bits of dissection are easy: orange and blue go in separate sections of the diagram. Both balloons are knotted; this fact is listed in the overlapping space. So do the words “same size.” Then the children hit a brief impasse until someone realizes that they can go further if they ask some questions: Are the balloons made of the same material? Are they filled with the same gas? Is one, perhaps, filled with water? The questions help them to see beyond physical features and recognize that there is more to the balloons than meets the eye.
When the Venn diagram is finished, the end result looks something like the image above right. The information is accurate. The children have asked some astute questions. They understand the balloons better. But have they engaged in analysis as defined by Bloom’s taxonomy? Well…sort of. Have they used higher-level thinking skills? No, not really.
This is a source of confusion among educators because Venn diagrams have become a staple of “analysis” exercises. To understand why a Venn diagram doesn’t automatically count as analysis, let’s take a closer look at how Bloom and his colleagues described this stage of the taxonomy.
The Three Levels of Analysis
Analysis, as presented by Bloom, has three levels. The levels build, each being more complex and abstract than the one before.
- Level 1: “…break down the material into its constituent parts, to identify or classify the elements…”
- Level 2: “…make explicit the relationships among the elements, to determine their connections and interactions…”
- Level 3: “ …recognize the organizational principles, the arrangement and structure, which hold together the communication as a whole.” (Bloom, 1956, p. 145, emphasis added)
Analysis, Level 1: Taking Things Apart
Most of the confusion about what is and what isn’t analysis occurs at the first level. The source of the confusion is that the objectives of this level seem to overlap with the objectives of the lower-level stage called Understanding. Each stage of reasoning requires taking things apart.
| Understanding | Analysis |
|---|---|
| …reordering…ideas into a new configuration… thinking about the relative importance of the ideas, their interrelationships, and their relevance to generalizations… (Bloom, p. 90) | …break down the material into its constituent parts, to identify or classify the elements… (Bloom, p. 145) |
Placed side by side, it’s hard to see a meaningful difference between “reordering ideas in a new configuration” in Understanding and “breaking down material into its constituent parts” in Analysis. In fact, “compare” and “contrast” are now, in the revised taxonomy, listed under Understanding (Anderson, et al., 2001), even though many exercises that are classified as analysis begin with those words. The distinction between Understanding and Analysis lies in what happens next in the lesson. Understanding entails having a grasp of literal meaning. Analysis is the search for deeper meaning beyond the literal facts. A Venn diagram works as analysis if: (1) the sorting results in a meaningful classification of relationships or organizational principles (which the balloon comparison does not), or (2) the results are used as the foundation for a subsequent search for relationships, principles, or structures.
Analysis, Level 2: Seeing Relationships
It is not the Venn diagram but the questions that accompany the Venn diagram that determine whether or not an exercise fits under Understanding or Analysis. To engage students in analysis, a lesson must have a goal beyond simply completing the diagram; the diagram must serve as a stepping stone to a new insight. A teacher seeking to help students see relationships between two balloons might use a Venn diagram to discuss the possible relationships between color, material, and endurance. Is it possible that dark-colored balloons hold helium better than light-colored balloons? Or perhaps slightly thicker balloons last longer when rubbed on a shirt and hung on a wall. In this process, students begin to discriminate between important and unimportant information. Color might matter when thinking about how balloons expand but not when thinking about balloons sticking to a wall.
Analysis, Level 3: Connecting to Principles
The third level of analysis requires that students recognize deep principles represented in the Venn diagram. Maybe they can learn something about form and function through their study of balloons, or maybe they can think about how gases respond differently to changes in the environment. Perhaps, if the lesson is about the color wheel, students will learn something important about complementary or coordinating colors, or even about color psychology and how color can affect mood. At the most abstract level, there may be a lesson about form and function. If the lesson is designed for students to understand something about the color wheel, then questioning should follow one direction; if the purpose of the lesson is to uncover the relationships between different kind of gases, then questions take a different direction.
When is a Venn diagram a part of analysis? When it is enveloped in a larger plan that takes students to a deeper understanding.
Ensuring that Your Venn Diagram Results in Analysis
- Remember that most of the time, the difference between understanding and analysis lies in what happens after the Venn diagram is completed.
- Know in advance the relationships or principles you want the students to see in the results of their Venn diagram.
- Ask questions that lead students to discriminate between relevant and irrelevant information (an analysis of color scheme may use different information than an analysis of balloon endurance, for example).
- Help students see the difference between understanding and analysis using statements such as: “The Venn diagram helps us understand how these balloons are similar and how they are different. Now let’s analyze our results to see what else we can discover.”
References
Anderson, L. W. & Krathwohl, D. R. (Eds.). A taxonomy for learning, teaching and assessing: A revision of Bloom’s taxonomy of educational objectives. Addison Wesley Longman.
Bloom, B. S. (Ed.). (1956). Taxonomy of educational objectives: The classification of education goals. Handbook I: Cognitive domain. David McKay.

Dr. Shelagh Gallagher is an author, presenter, and nationally recognized gifted education consultant who spent more than a decade conducting research and teaching graduate courses in gifted education at the University of North Carolina at Charlotte. She is the author of several award-winning Problem-Based Learning units.